
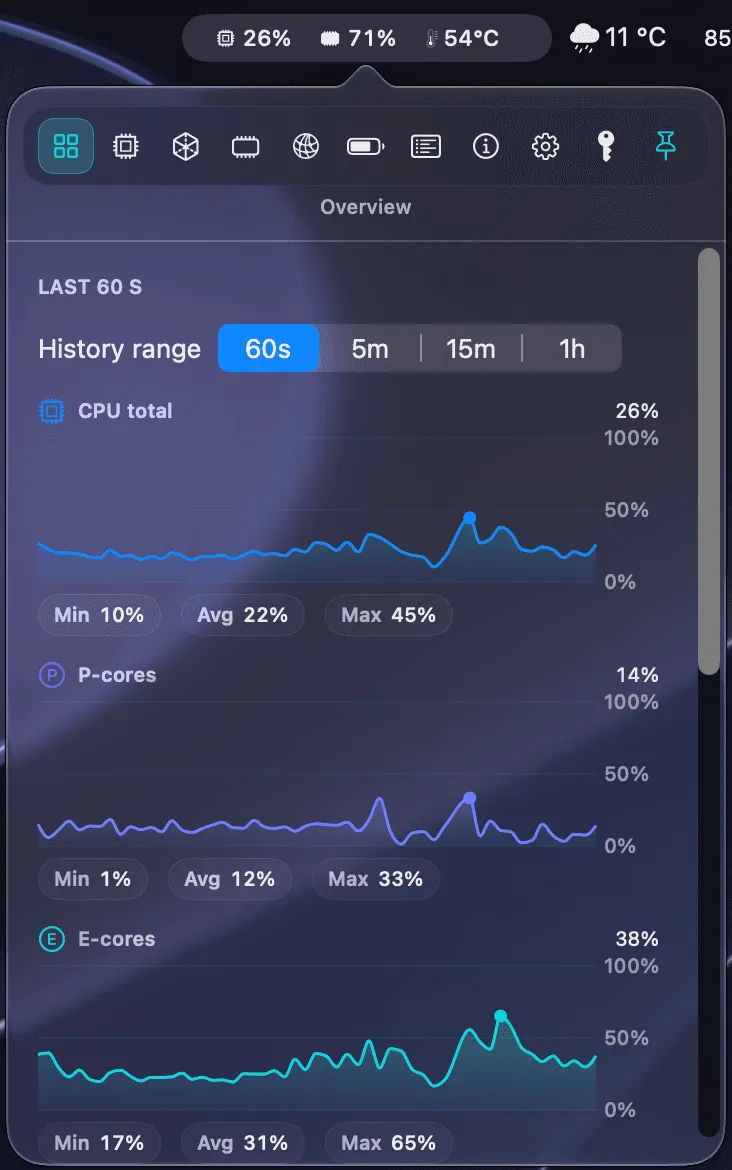
MenuBarMonitor is a native system resource monitor that displays live CPU, GPU, RAM, temperature, and battery metrics as compact tiles in the menu bar, providing a persistent system overview without opening a separate application. (€14.99, one-time)
The app surfaces granular metrics that Activity Monitor does not expose in the menu bar by default. The CPU display separates performance and efficiency cores with per-core frequency readings, relevant for Apple Silicon chips. Memory monitoring uses kernel-level pressure readings with a one-click RAM relief option. Battery information includes charge level, health, voltage, and current power draw.
Additional panels cover disk I/O with per-volume read/write throughput and IOPS, fan speed with RPM and load percentage, and a background hog detector that identifies applications consuming significant CPU while not in the foreground. A compact mode reduces the menu bar footprint to a single headline tile showing the most critical current metric. A floating mini widget provides desktop-level metric display outside the menu bar. Tile order is customizable via drag-and-drop, and the interface is available in 13 languages.
The app operates with Hardened Runtime enabled, no sandbox restrictions for live readings, no elevated privileges, and no telemetry.
System requirements: macOS 13 Ventura or later. Native Apple Silicon and Intel support. Direct purchase from developer website; no App Store listing.
Pricing: (€14.99, one-time; all future updates included.)
Limitations: License is valid for one personal Mac only; multi-machine use requires additional purchases. No App Store availability, which removes sandboxed installation. Sandbox-free architecture provides broader system access but is a consideration for security-conscious users.
Alternatives: iStatMenus ($14.99/year or $49.99 one-time) offers a longer track record with similar depth. Stats (free, open-source) provides basic CPU, GPU, memory, and network monitoring. Activity Monitor (built-in) shows similar data in a separate window without menu bar persistence.
Suitable for users who need persistent, at-a-glance system metrics with per-core CPU detail, kernel-level memory readings, and background process monitoring without switching to a dedicated application.